Data Science: Estimating Model Performance. Cross Validation and the Bootstrap
So you’ve decided on your model for your dataset. How can we now go and see how good that model is?
Maybe we can find the error rate for our training set, or the error from our test set.
A better way to test the error of the model is through cross-validation.
Cross Validation (The Elements of Statistical Learning, Friedman)
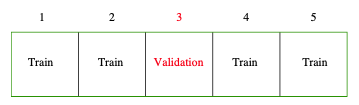
First we begin by partitioning the data up into $K$ sets of approximately equal size. Then for the $k$th part, we fit the model to the other $K-1$ parts and calculate the prediction error. This processes is completed for all $K$ sets.
There is a special case of cross validation where we have that $K = N$. That is, the number of sets is equal to the number of data points. We would therefore be leaving one item out in each training/prediction cycle. That is why this is known as Leave One Out Cross Validation (LOOCV).
This LOOCV is often not used because
- we have to fit the model N times so it is very computationally expensive
- The models will be very similar which means we will have high correlation between samples and therefore high variance of the estimates
It’s much more convenient to choose $K=5$ or $K=10$ for the cross validation. Although the accuracy of the estimate may be less since we are using less sets, the variance of the estimate will also be lower. This trade-off between bias and variance is known as the bias-variance tradeoff.
Bootstrap 🔗︎
One other very interesting statistical technique that is used to measure the accuracy of estimators or methods is the bootstrap.
Imagine we have a set of $N$ data points. We then create multiple sub-samples by sampling $N$ points from the main data set with replacement. So that means when we choose something from the set, we can choose that item again.
What happens then is we have created our bootstrap samples.
A quick look at the mathematics with proof here shows that about 63% of the data points will be contained at least once in each of the new samples.
A very useful aspect to this bootstrap method means we can now calculate and get information about relevant statistics.
For example using the sample we can usually get a mean and standard deviation with no problems. Now, with the bootstrap, we can calculate the standard error for other statistics such as the median, which normally isn’t possible.
We can do this by getting the mean median for each bootstrap sample, and then calculating the standard deviation in the usual way.
Conclusion 🔗︎
I learnt the material for this blog post as part of my studies in Data Science at the University of Adelaide. The final exam will be completed on Friday the 27th of November! My last University exam ever.